5. Generating Call Trace Files
Java applications run in different runtime configurations like Applets, Swing/SWT based GUI applications, non-GUI applications (batch/socket server apps, etc), J2EE server applications etc. MaintainJ supports many of these configurations out of the box with the help of wizards. Check the Introduction page for the supported configurations and related demo videos. The following sections explain generating the call trace files using these wizards and even without using the wizards.
5.1 Generating call trace for J2EE Applications
5.2 Generating call trace for J2SE (Swing or non-GUI), Applets and JUnit
5.3 Generating call trace for Java Applications run from command prompt
5.4 Generating call trace files on Multiple JVMs and merging the trace files
5.5 Generating call trace files without a MaintainJ wizard
5.1 Generating call trace for J2EE Applications
Download MaintainJ.war. MaintainJ.war installs MaintainJ related jar files to the application server and configures your J2EE application for instrumentation. Deploy MaintainJ.war to the same server instance where you are running your application. Open http://server/MaintainJ/index.jsp for installation and configuration page and follow the instructions. Check the screenshots.
5.2 Generating call trace for J2SE (Swing or non-GUI), Applet and JUnit Applications
Demo Videos: MaintainJ for Swing, Applet, JUnit
Use this if you are currently running your application in Eclipse using Java Application / Java Applet / JUnit run configurations.
1) Click Run-->Run Configurations in Eclipse to open the run configurations dialog.
2) On the left hand side, you will see three MaintainJ configurations for Java Applets, Java Applications and JUnit as highlighted in the screenshot below. MaintainJ run configurations are the same as normal configurations except for the MaintainJ tab, which is the second from left.
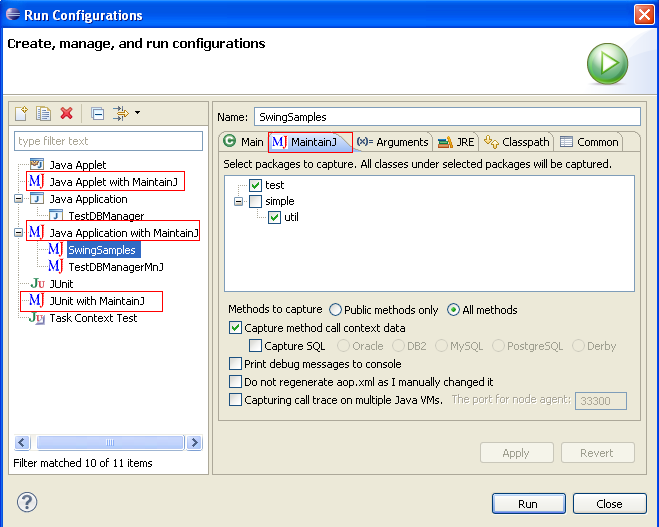
3) Create a new configuration for your type of application just as you would when running without MaintainJ. In the MaintainJ tab, choose the packages that you want to capture. Choose only the packages of interest and avoid very high level packages. If you want to capture the values of parameters and return value for each call, select 'Capture method call context data'. You can also capture the actual runtime sql statements your application is sending to the database server by selecting 'Capture SQL' and then choosing your database.
4) Run the application or Applet or JUnit test cases. This will create 'maintainj/META-INF/aop.xml' file in your main project's root folder. If you would like to manually edit aop.xml and do not want the wizard to overwrite your changes, select 'Do not regenerate aop.xml' checkbox.
5 a) For JUnit test cases, this will also create 'maintainj\JUnitTraceFiles' folder under which the trace files will be written for each test case. This is the last step if you are using MaintainJ with JUnit test cases.
5 b) For J2SE applications and applets, a Swing window will open along with your application/applet. Enter a file name with full path and without extension and click 'Stop Tracing' to log the call trace up to the point of starting the application. The generated trace file names, locations and number of calls in each file will be displayed. One trace file for each active thread will be generated. The thread name is appended to the given trace file name. Trace files have the extension 'ser'.
6) Once 'Stop Tracing' is clicked, the button is reset to 'Start Tracing' as above. Before performing an action for which a trace file is needed, click 'Start Tracing', perform the action and click 'Stop Tracing' to generate a new trace file.
7) Copy the trace files to a MaintainJ Trace Files Project in Eclipse and open to view the UML diagrams. MaintainJ Trace Files Project can be created by by following File->New->Project->MaintainJ->MaintainJ Trace Files Project.
5.3 Generating call trace for Java Applications run from command prompt
Demo Videos MaintainJ for Applications run from command prompt
This Swing based Wizard supports generating trace files for any Java application that is run from the command prompt (instead of running from Eclipse). The following steps explain how this wizard is used.
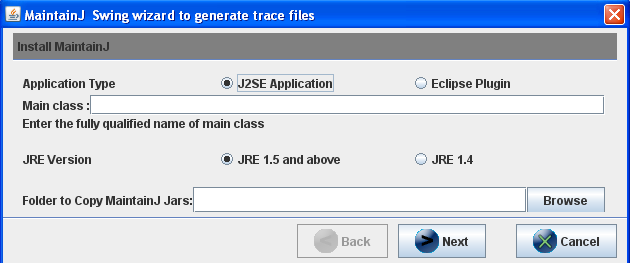
1) Download MaintainJSwingWizard.jar and start the Wizard using 'java -jar MaintainJSwingWizard.jar'
2) Select Application Type as J2SE Application. Select a folder to copy the MaintainJ related files. Provide the absolute name of the main class (the class with public static void main(String[]) method).
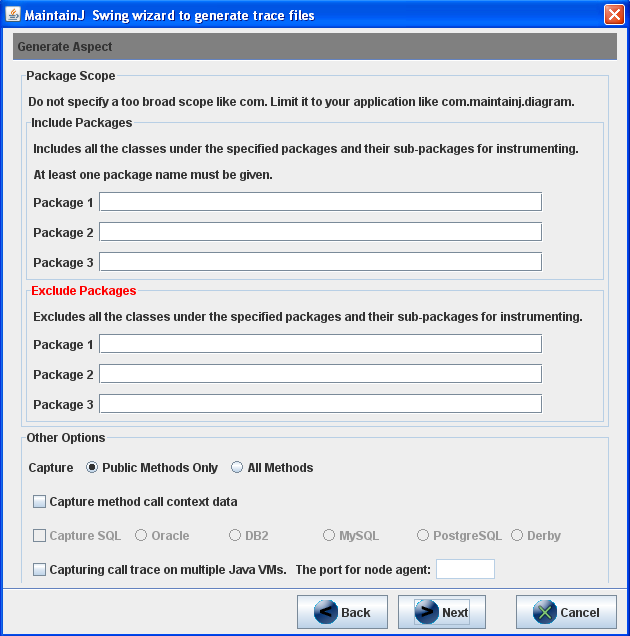
3) Choose the package(s) in the application or plug-in. Limit the instrumentation scope to your application or plug-in classes. You may also exclude the package(s) that are not of interest. The other options are same as explained above in section 5.2
4) The wizard copies MaintainJ jar files, META-INF/aop.xml (the aspect) and start_with_maintainj.bat to the installation folder. Edit start_with_maintainj.bat to set application classpath.
5) When the Java application, a 'MaintainJ - Start and Stop Tracing' Swing window pops up. This is the same window as shown in the last section. Enter a file name with full path and without extension and click 'Stop Tracing' to log the call trace up to the point of starting the plug-in. One or more trace files with the given file name with thread name appended (Ex: EclipseShapeDropped_main.ser) are generated. One trace file for each active thread is generated.
6) Once 'Stop Tracing' is clicked, the button is reset to 'Start Tracing'. Before performing an action for which a trace file is needed, click 'Start Tracing', perform the action and click 'Stop Tracing' to generate a new trace file.
5.4 Generating call trace files on multiple JVMs and merging the trace files
MaintainJ supports tracing applications running on multiple JVMs simultaneously and merging the trace files for a end-to-end call flow. For example, consider a scenario where a J2EE application calls a web service running on a different J2EE server. You may be interested in seeing the end-to-end call flow of a request going from the J2EE application to the web service and coming back. You can do this by following the steps below.
This feature is supported only for JRE 1.5 and above.
1) Start MaintainJ Node Manager window using
'java -classpath
2) While starting the applications with MaintainJ, select the option to trace multiple JVMs and provide a port number to start the MaintainJ Node Agent. You will see this option on all MaintainJ wizards. In the Eclipse run configuration MaintainJ tab, select 'Capturing call trace on multiple Java VMs'. Select the same option if you are using MaintainJSwingWizard explained in section 5.3. If you are tracing a J2EE application using MaintainJ.war, you will see the same option in 'Step 5: Capture call trace'.
3) You may trace any combination of Java applications running on different JVMs - multiple J2EE applications or a socket server application and a J2EE application, etc. Once all the applications are started with MaintainJ, go back to the MaintainJ Node Manager window opened in step 1.
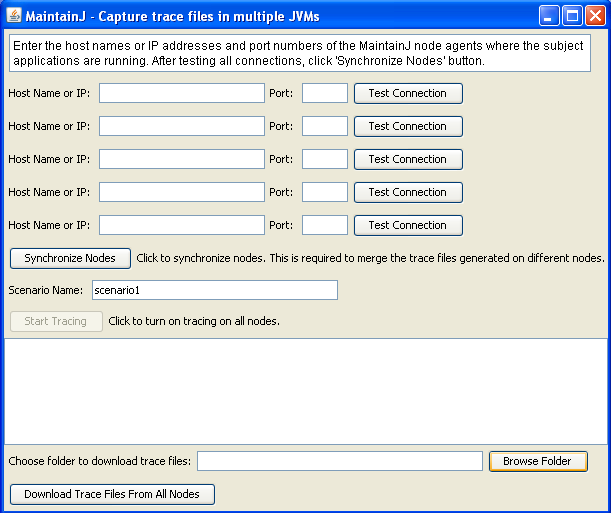
4) Enter the IP addresses of the machines where you are running your applications and the port numbers you gave in step 2. Click 'Test Connection'. Make sure that the status changes to 'Tested'.
5) Click 'Synchronize Nodes' button.
6) Enter the name of the scenario. This will be used to as an identifier for the generated trace files.
7) Click 'Start Tracing' when you are ready to trace.
8) Run the scenario in your application and click 'Stop Tracing'.
9) You will see the list of generated trace files. Click 'Download trace files from all nodes' if you want to copy all the trace files to a local folder.
10) You can merge these trace files using Merge Trace Files wizard (at File->New->Other->MaintainJ->Merge Trace Files) to view them in a single sequence diagram.
5.5 Generating call trace files without a MaintainJ wizard
If the wizards that come with MaintainJ do not work for your application, you can still generate the trace files using the procedure below.
There are 3 steps to instrument your application and generate the trace files. The first two steps will instrument the application. The last step will set the start and end points of the use case and will write the call trace to a file.
1. Prepare the MaintainJ configuration file
Below is a sample maintainj.xml configuration file.
<aspectj>
<aspects>
<concrete-aspect name="com.maintainj.inst.J2EEAspect" extends="com.maintainj.aspect.ExecutionAspect">
<pointcut name="anyExecution" expression="execution(* *.*(..)) || execution(*.new(..))"/>
</concrete-aspect>
</aspects>
<weaver options="-proceedOnError -showWeaveInfo -verbose ">
<include within="com.test..*"/>
</weaver>
</aspectj>
The only line that must be changed is the one within 'weaver options' section in blue. Replace 'com.test' package with a package in your application. Only the classes under the included packages and their sub-packages will be captured in the diagrams. You may include as many packages as you want. If you want to include a class, simply replace 'com.test..*' with the class name. You can also exclude some classes or packages similarly using the 'exclude' keyword.
The above xml file does not capture method call context data, JSP's and the SQL statements. If you want to add those options, either contact MaintainJ customer support or use one of the wizards to first generate the xml and then edit it as necessary.
2. Update JVM arguments
Add the below two JVM arguments.
        -javaagent:<
        PathTo
        >\MaintainJAgent.jar


        -Dorg.aspectj.weaver.loadtime.configuration=file:<
        PathTo
        >\maintainj.xml
3. Generate trace file
The challenge here is to find a way to turn on and turn off tracing. In the wizards that come with MaintainJ, this is done using a Swing window for J2SE applications. For J2EE applications, this is done using a JSP. But you are free to devise your own method.
a) To turn on tracing, call the following method. JoinPointMap class is present in MaintainJAspect.jar.
JoinPointMap.setAddJoinPoint(true);
b) To write the call trace to a file and turn off tracing use the following statements.
JoinPointMap.setAddJoinPoint(false);

          String[][] serFiles = JoinPointMap.writeToFile("c:\\TraceFile");

          JoinPointMap.clear();
The input to JoinPointMap.writeToFile() is the trace file name, which is given without any extension. This method returns a String[][] where String[][0] is the generated trace file name and String[][1] is the number of calls in that trace file. The extension .ser is automatically added to the file name. One trace file for each thread in the use case is generated.